
MLB Prediction Showdown: Fangraphs vs. FiveThirtyEight
Published:
In 2008, Nate Silver created the website FiveThirtyEight with the goal of using data-driven analysis to raise the bar of political coverage and predictions (Link). Silver also has history with baseball analytics, creating a player performance forecast model called PECOTA and writing for Baseball Prospectus. So it was no surprise when FiveThirtyEight rolled out a model to predict MLB games in 2016.
As a data scientist, I have long been curious as to how FiveThirtyEight’s predictions compare to Fangraphs. In this blog post, I will focus on the regular-season-game win probability for the home team provided by the two websites to determine which website came out on top from 2016 to 2018.
Methodologies
To begin, let’s review their respective methodologies.
- FiveThirtyEight
FiveThirtyEight’s predictions use Elo ratings with pitcher, home-field, and travel adjustments. Each team’s preseason ratings are derived from the previous season Elo rating along with an adjustment incorporating PECOTA, FanGraphs, and Davenport projections (Link).
- Fangraphs
The Fangraphs predictions use the ZiPS and Steamer projections for the starting lineups with a 4% adjustment for the home team (Link).
Exploratory Data Analysis
To start our analysis of the data, we’ll take a look at the probabilities. We can notice some slight differences when comparing Fangraphs to FiveThirtyEight, where the former seems to be slightly more in favor of the home team.
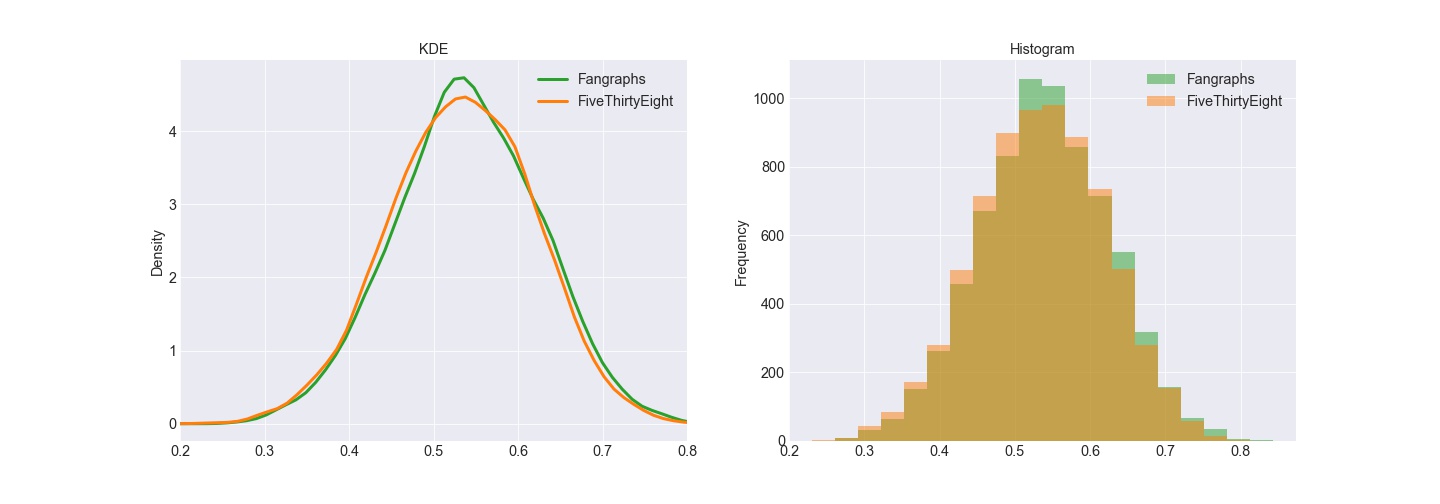
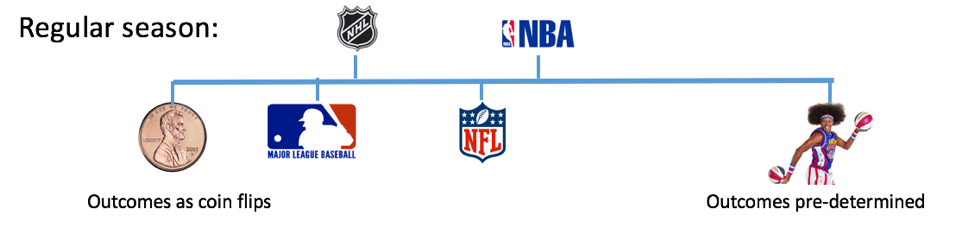
Baseball is an extremely difficult game to project. Michael Lopez, Ben Baumer, and Greg Matthews found it is the major American sport closest to a coin-flip which explains why the predictions from both sources are centered near 50%.
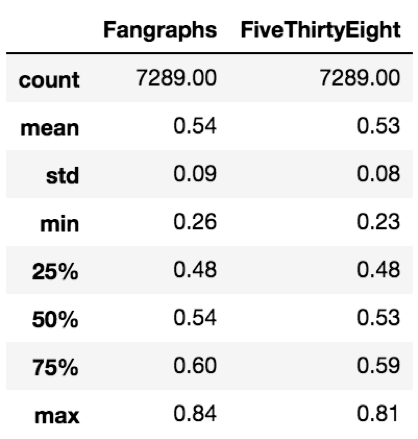
After taking the summary statistics of these predictions for the home team, we see the mean and median for the projections are 54% for Fangraphs and 53% for FiveThirtyEight. The percentage of games the home team won from 2016 to 2018 is 53.2%. Clearly both projection systems account for the home-field advantage, but it appears Fangraphs might assess too stiff of a penalty to the visiting team.
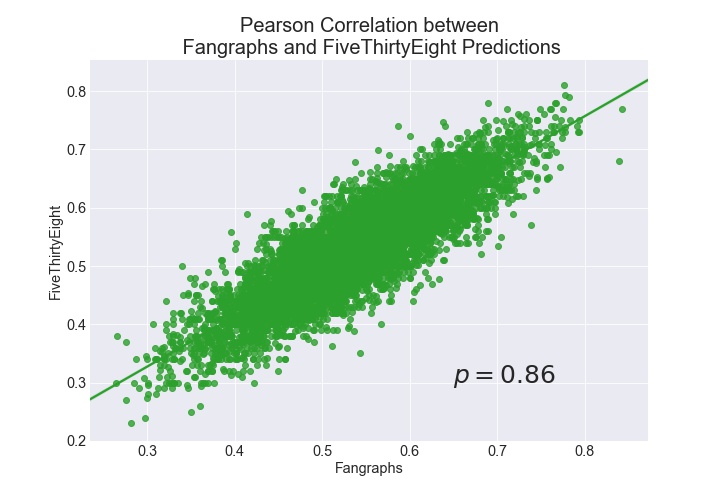
When taking a look at the correlation between the predictions, we find a Pearson correlation coefficient of .86. This means there is a strong relationship but still enough room to evaluate how they differ.
Accuracy
The first metric we will use is accuracy, which means, of all of the games, how many did each model predict correctly. Using this metric, FiveThirtyEight is a slightly more accurate model, predicting 57.7% of games correctly compared to 56.9% for Fangraphs. When evaluating accuracy by year, FiveThirtyEight is consistently more accurate. FiveThirtyEight and Fangraphs are about 3 to 6 percent better than a naive model that predicts the home team will win each game.
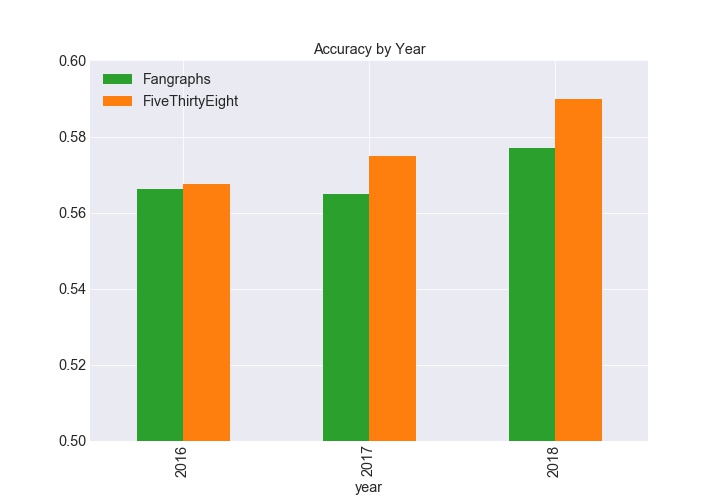
So FiveThirtyEight wins right? Well in the immortal words of Lee Corso, “Not so fast my friend!” There are a number of other evaluation metrics we can use to understand the performance of the models and their respective strenghths and weaknesses.
Log Loss
Given how close the two models are in accuracy, it is worth evaluating other metrics. Instead of evaluating the model based on if the home team wins or not, we will be evaluating the model based on the probability predicted for each game.
For example, if the prediction is a 50/50 chance, the log loss for that game will be 0.69315 whether the home team loses or wins. Error approaches 0 if the prediction is correct (lower is better), but approaches infinity if a wrong prediction of close to 0% or 100% is made.
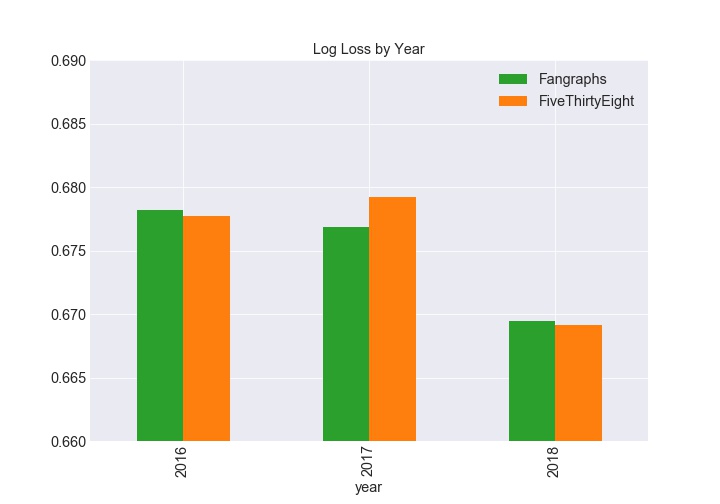
From 2016 to 2018, FiveThirtyEight’s log loss was 0.6754, and Fangraphs log loss was .6748, meaning from a log loss perspective, Fangraphs was slightly better. For reference, a naive model predicting 53.2% for the home team would have a log loss of .691.
Looking at the log loss by year tells a slightly different story. FiveThirtyEight actually had slightly lower log loss in both 2016 and 2018.
Precision and Recall
So far we haven’t been able to determine a major difference between the two models. Precision and recall are very important in machine learning as they allow us to deal with problems that have a class imbalance, or if there are different costs associated with false negatives and false positives.
In our case, Precision is the percentage of predicted home team wins correctly predicted. Recall is the percentage of home team wins correctly predicted. FiveThirtyEight has a higher precision (58% to 57%), but Fangraphs has a higher recall (74% to 73%).
This makes sense, as FiveThirtyEight is less likely to favor the home team as we saw earlier in the distribution plots. Fangraphs predicted the home team to win in 68.8% of the games compared to 66.7% for FiveThirtyEight.
While these metrics don’t help us declare a winner, it helps us determine what each is doing differently. To dig in a little further, we can consider how each model performs over the course of the season.
Time Series
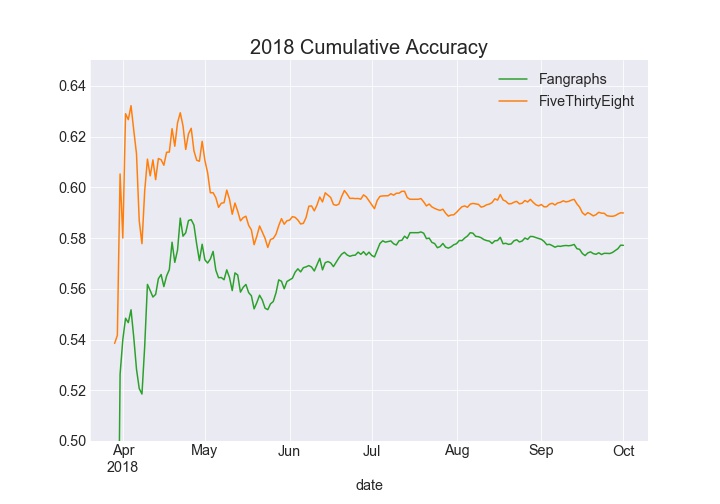
Looking at the cumulative accuracy by day, some interesting trends appear. Before analyzing the data, my hunch was Fangraphs would be better at predicting games early in the season as I was skeptical ELO can properly adjust year-to-year with the amount of changes teams make in the offseason. The 2016 and 2017 charts somewhat confirm this expectation, with the Fangraphs accuracy higher in April, and May. But there is an interesting pattern where FiveThirtyEight is able to surpass Fangraphs in cumulative accuracy. In 2018, FiveThirtyEight lead all year in cumulative accuracy.
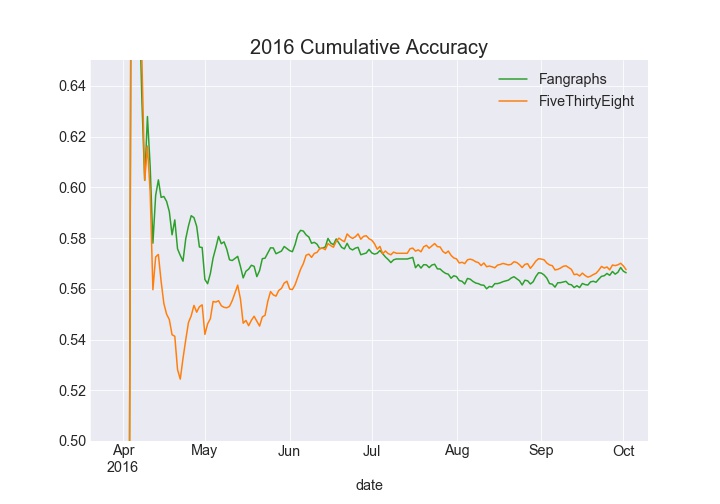
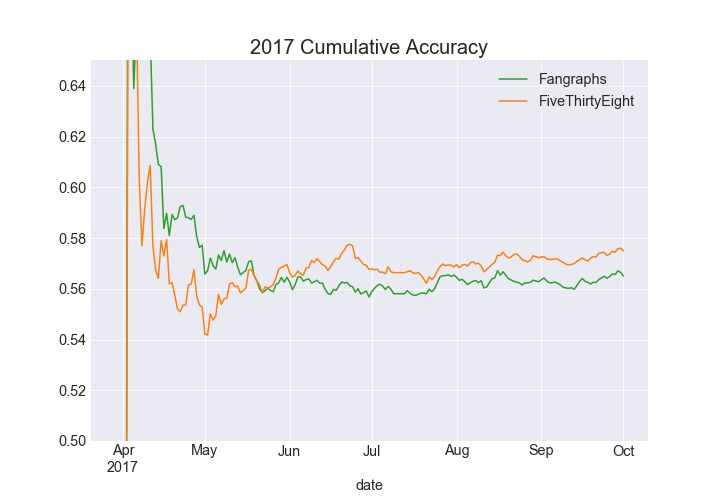
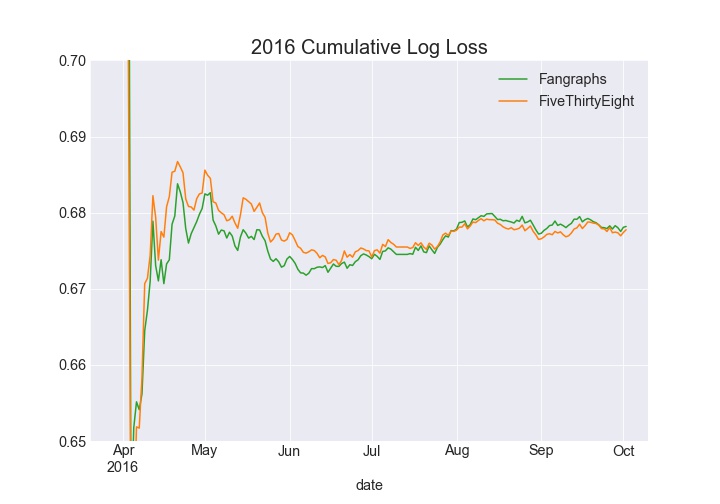
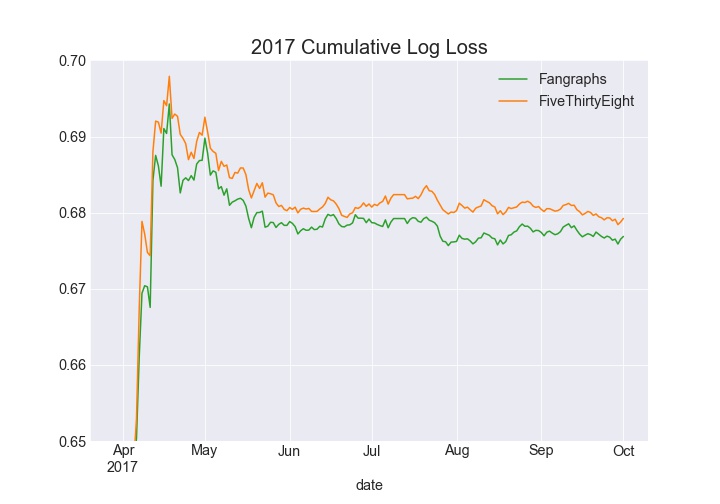
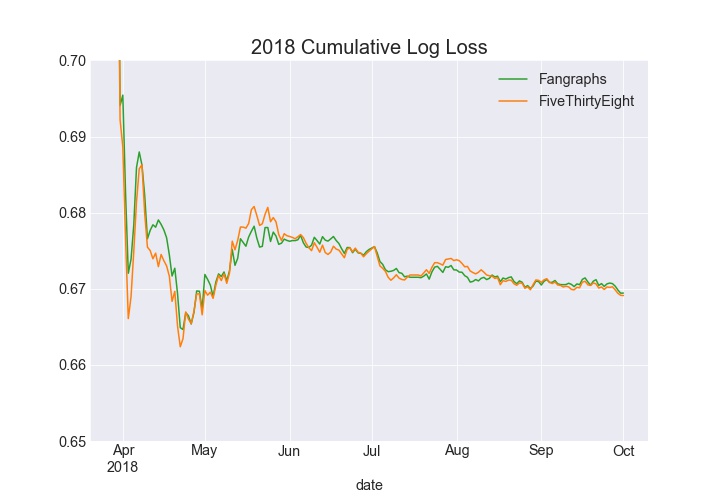
The cumulative log loss chart for 2016 tells a similar story where FiveThirtyEight lags (lower is better) behind early and is able to pull away later in the year. In 2017 Fangraphs led all season long, and 2018 was close throughout the season.
The in-year improvement in performance demonstrates the possibility FiveThirtyEight’s ELO method is able to adjust to in-season developments faster than the Fangraphs model, or perhaps it is able to pick up on things purely talent-based projections can’t measure (chemistry?). Further analysis would be needed to confirm.
What accounts for the difference?
So far we’ve established FiveThirtyEight has a slightly better accuracy, while Fangraphs has better log loss. The models only disagree on 15% of the games. The home team wins 48% of those games. Given that Fangraphs adjusts the home team a constant 4%, it appears that may be too much of an adjustment.
A quick example of how FiveThirtyEight handles home-field advantage can be seen when comparing two games from the Mariners 2018 season.
Seattle Mariners @ Kansas City Royals 4/9
- Mariners traveled from Minnesota on 4/7 with a day off on 4/8 (travel adjustment: 0)
- Royals played in Cleveland on 4/8 the day before (home adjustment: 24, travel adjustment: -3)
- Home Team Adjustment: 21 points (approx 2.75%)
Seattle @ Texas 8/7
- Mariners traveled from Cleveland (travel adjustment: -4)
- Texas played in Texas the night before (home adjustment: 24, travel adjustment: 0)
- Home Team Adjustment: 28 points (approx 3.85%)
As we can see, a dynamic approach allows for a slightly more nuanced home-field advantage that adjusts based on travel schedules.
Another difference is the different pitcher evaluation metric used. FiveThirtyEight uses a rolling Game Score as opposed to the ZiPS and Steamer projections at Fangraphs.
Takeaways
- Both FiveThirtyEight and Fangraphs perform about 3 to 6 percent better than a naive model.
- FiveThirtyEight is slightly more accurate on a yearly basis, whereas Fangraphs has the slight edge in log loss
- Part of FiveThirtyEight’s edge in accuracy is due to a smaller home-field advantage adjustment.
When evaluating accuracy over the course of the season, there is some evidence that FiveThirtyEight’s ELO methodology is able to improve relative to Fangraphs. This may be due to:
a) A quicker in-season adjustment to player talent changes, and/or
b) An ability to pick up on other factors present in a teams ability to win not captured by projection systems
Future Research
- Ensemble methods
- Other probabilistic forecasts
- Betting strategies
- Additional evaluation metrics
- Team-level analysis
- Pitcher-level analysis
The code for this analysis can be found here